
 - Blog
| Conference: | BSth |
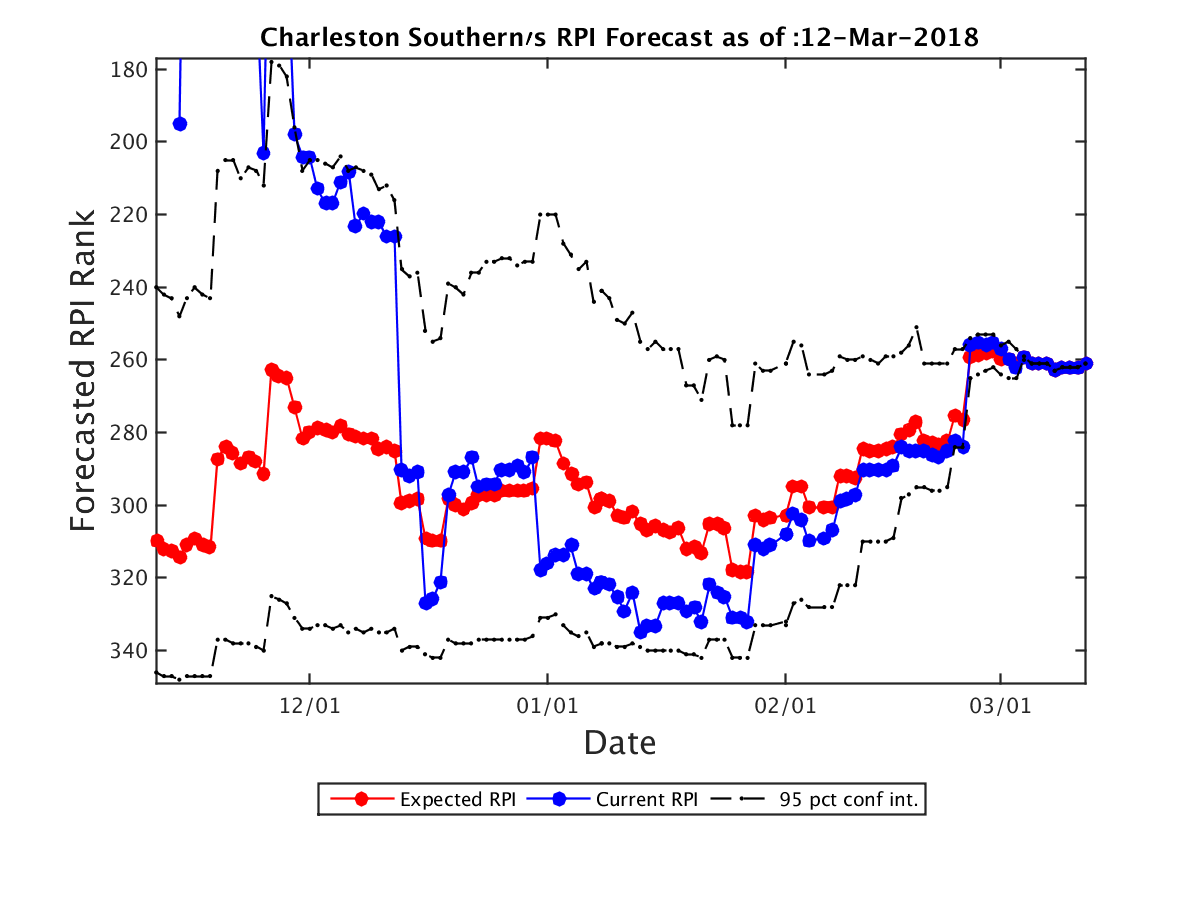
| Expected RPI: | 261.0 |
| Current RPI: | 261 |
| Expected SOS: | 314 |
| Current SOS: | 314 |
| Current Record: | 12-16 |
| Expected Record: | 12-16 |
| Current Conf Record: | 10-10 |
| Expected Conf Record: | 10-10 |
| Expected Record vs RPI 1-25: | 0-0 |
| Expected Record vs RPI 26-50: | 0-1 |
| Expected Record vs RPI 51-100: | 1-2 |
| Expected Record vs RPI 101-200: | 2-5 |
| Expected Record vs RPI 200+: | 9-8 |
| Current OOC Record: | 2-6 |
| Expected OOC Record: | 2-6 |
| Expected OOC RPI: | 292 |
| Expected OOC SOS: | 313 |
| Final Record | Expected RPI | Probability |
|---|---|---|
| 12-16 | 261.0 | 100.00% |
| Date | Opponent (Expected RPI) | Conf | Location | Score | Outcome | Prob(W) | Spread |
|---|---|---|---|---|---|---|---|
| 11-10 | Davidson (47.0) | A10 | A | 110-62 | L | 0% | 0.0 |
| 11-12 | North Carolina St. (64.0) | ACC | A | 78-56 | L | 0% | 0.0 |
| 11-18 | USC Upstate (344.0) | ASun | A | 72-82 | W | 100% | 0.0 |
| 11-25 | Illinois St. (85.0) | MVC | A | 62-64 | W | 100% | 0.0 |
| 11-28 | VMI (313.0) | SC | H | 68-76 | L | 0% | 0.0 |
| 12-12 | South Carolina St. (331.0) | MEAC | A | 91-88 | L | 0% | 0.0 |
| 12-15 | Eastern Kentucky (271.0) | OVC | H | 65-70 | L | 0% | 0.0 |
| 12-18 | Florida St. (54.0) | ACC | A | 69-58 | L | 0% | 0.0 |
| 12-30 | Longwood (337.0) | BSth | H | 84-43 | W | 100% | 0.0 |
| 1-2 | Liberty (211.0) | BSth | A | 70-53 | L | 0% | 0.0 |
| 1-6 | High Point (273.0) | BSth | A | 80-59 | L | 0% | 0.0 |
| 1-9 | Radford (128.0) | BSth | H | 61-64 | L | 0% | 0.0 |
| 1-12 | Winthrop (173.0) | BSth | H | 53-64 | L | 0% | 0.0 |
| 1-15 | UNC Asheville (130.0) | BSth | A | 83-73 | L | 0% | 0.0 |
| 1-18 | Campbell (267.0) | BSth | A | 62-47 | L | 0% | 0.0 |
| 1-21 | Gardner Webb (244.0) | BSth | H | 83-68 | W | 100% | 0.0 |
| 1-24 | Presbyterian (319.0) | BSth | H | 49-57 | L | 0% | 0.0 |
| 1-27 | Radford (128.0) | BSth | A | 81-84 | W | 100% | 0.0 |
| 2-1 | High Point (273.0) | BSth | H | 83-74 | W | 100% | 0.0 |
| 2-3 | Gardner Webb (244.0) | BSth | A | 63-61 | L | 0% | 0.0 |
| 2-7 | Liberty (211.0) | BSth | H | 87-75 | W | 100% | 0.0 |
| 2-10 | Presbyterian (319.0) | BSth | A | 54-64 | W | 100% | 0.0 |
| 2-15 | Longwood (337.0) | BSth | A | 65-77 | W | 100% | 0.0 |
| 2-18 | UNC Asheville (130.0) | BSth | H | 80-85 | L | 0% | 0.0 |
| 2-22 | Campbell (267.0) | BSth | H | 72-68 | W | 100% | 0.0 |
| 2-24 | Winthrop (173.0) | BSth | A | 75-78 | W | 100% | 0.0 |
| 2-27 | Presbyterian (319.0) | BSth | H | 68-51 | W | 100% | 0.0 |
| 3-1 | UNC Asheville (130.0) | BSth | A | 71-66 | L | 0% | 0.0 |
| Team | Conf | Curr Wgt | Fut Wgt | Curr W/L | Exp W/L | Curr Impact | Exp Impact |
|---|---|---|---|---|---|---|---|
| Charleston Southern | BSth | 26.63 | 26.63 | 45.45 | 45.45 | -2.42 | -2.42 |
| UNC Asheville | BSth | 6.49 | 6.49 | 57.14 | 57.14 | 0.93 | 0.93 |
| Presbyterian | BSth | 6.48 | 6.48 | 26.92 | 26.92 | -2.99 | -2.99 |
| Radford | BSth | 4.89 | 4.89 | 63.33 | 63.33 | 1.30 | 1.30 |
| Liberty | BSth | 4.88 | 4.88 | 55.17 | 55.17 | 0.50 | 0.50 |
| Longwood | BSth | 4.82 | 4.82 | 14.29 | 14.29 | -3.44 | -3.44 |
| Winthrop | BSth | 4.80 | 4.80 | 57.69 | 57.69 | 0.74 | 0.74 |
| Gardner Webb | BSth | 4.76 | 4.76 | 37.04 | 37.04 | -1.23 | -1.23 |
| Campbell | BSth | 4.75 | 4.75 | 46.15 | 46.15 | -0.37 | -0.37 |
| High Point | BSth | 4.71 | 4.71 | 40.00 | 40.00 | -0.94 | -0.94 |
| VMI | SC | 2.05 | 2.05 | 22.22 | 22.22 | -1.14 | -1.14 |
| USC Upstate | ASun | 2.00 | 2.00 | 11.11 | 11.11 | -1.55 | -1.55 |
| South Carolina St. | MEAC | 1.97 | 1.97 | 24.14 | 24.14 | -1.02 | -1.02 |
| North Carolina St. | ACC | 1.97 | 1.97 | 64.52 | 64.52 | 0.57 | 0.57 |
| Davidson | A10 | 1.82 | 1.82 | 64.52 | 64.52 | 0.53 | 0.53 |
| Florida St. | ACC | 1.81 | 1.81 | 63.33 | 63.33 | 0.48 | 0.48 |
| Eastern Kentucky | OVC | 1.79 | 1.79 | 28.57 | 28.57 | -0.77 | -0.77 |
| Illinois St. | MVC | 1.79 | 1.79 | 54.84 | 54.84 | 0.17 | 0.17 |
| UNC Greensboro | SC | 0.39 | 0.39 | 77.42 | 77.42 | 0.21 | 0.21 |
| The Citadel | SC | 0.25 | 0.25 | 27.59 | 27.59 | -0.11 | -0.11 |
| Furman | SC | 0.24 | 0.24 | 67.74 | 67.74 | 0.09 | 0.09 |
| Western Carolina | SC | 0.22 | 0.22 | 36.67 | 36.67 | -0.06 | -0.06 |
| Wofford | SC | 0.22 | 0.22 | 60.00 | 60.00 | 0.04 | 0.04 |
| Jacksonville | ASun | 0.21 | 0.21 | 37.93 | 37.93 | -0.05 | -0.05 |
| Virginia Tech | ACC | 0.20 | 0.20 | 65.62 | 65.62 | 0.06 | 0.06 |
| Clemson | ACC | 0.20 | 0.20 | 71.88 | 71.88 | 0.09 | 0.09 |
| Charlotte | CUSA | 0.19 | 0.19 | 17.86 | 17.86 | -0.12 | -0.12 |
| Tennessee | SEC | 0.19 | 0.19 | 75.76 | 75.76 | 0.10 | 0.10 |
| North Carolina A&T | MEAC | 0.18 | 0.18 | 56.25 | 56.25 | 0.02 | 0.02 |
| Rhode Island | A10 | 0.17 | 0.17 | 78.12 | 78.12 | 0.10 | 0.10 |
| Southern Illinois | MVC | 0.15 | 0.15 | 59.38 | 59.38 | 0.03 | 0.03 |
| Miami FL | ACC | 0.15 | 0.15 | 70.97 | 70.97 | 0.06 | 0.06 |
| Boston College | ACC | 0.14 | 0.14 | 55.88 | 55.88 | 0.02 | 0.02 |
| Vanderbilt | SEC | 0.14 | 0.14 | 37.50 | 37.50 | -0.04 | -0.04 |
| Wake Forest | ACC | 0.14 | 0.14 | 35.48 | 35.48 | -0.04 | -0.04 |
| Stetson | ASun | 0.13 | 0.13 | 28.57 | 28.57 | -0.05 | -0.05 |
| Auburn | SEC | 0.13 | 0.13 | 78.12 | 78.12 | 0.07 | 0.07 |
| VCU | A10 | 0.12 | 0.12 | 54.55 | 54.55 | 0.01 | 0.01 |
| Florida Gulf Coast | ASun | 0.12 | 0.12 | 64.52 | 64.52 | 0.04 | 0.04 |
| Pittsburgh | ACC | 0.12 | 0.12 | 25.00 | 25.00 | -0.06 | -0.06 |
| Alabama St. | SWAC | 0.12 | 0.12 | 25.81 | 25.81 | -0.06 | -0.06 |
| Mercer | SC | 0.12 | 0.12 | 53.33 | 53.33 | 0.01 | 0.01 |
| Hampton | MEAC | 0.12 | 0.12 | 51.61 | 51.61 | 0.00 | 0.00 |
| East Carolina | Amer | 0.12 | 0.12 | 33.33 | 33.33 | -0.04 | -0.04 |
| Saint Louis | A10 | 0.12 | 0.12 | 50.00 | 50.00 | 0.00 | 0.00 |
| Austin Peay | OVC | 0.12 | 0.12 | 53.33 | 53.33 | 0.01 | 0.01 |
| Louisville | ACC | 0.11 | 0.11 | 60.61 | 60.61 | 0.02 | 0.02 |
| North Carolina | ACC | 0.11 | 0.11 | 71.43 | 71.43 | 0.05 | 0.05 |
| Nevada | MWC | 0.11 | 0.11 | 79.41 | 79.41 | 0.07 | 0.07 |
| College of Charleston | CAA | 0.10 | 0.10 | 77.42 | 77.42 | 0.05 | 0.05 |
| Abilene Christian | Slnd | 0.10 | 0.10 | 44.44 | 44.44 | -0.01 | -0.01 |
| Bowling Green | MAC | 0.10 | 0.10 | 46.67 | 46.67 | -0.01 | -0.01 |
| Georgia | SEC | 0.10 | 0.10 | 54.55 | 54.55 | 0.01 | 0.01 |
| Jacksonville St. | OVC | 0.09 | 0.09 | 62.50 | 62.50 | 0.02 | 0.02 |
| Colorado St. | MWC | 0.09 | 0.09 | 32.26 | 32.26 | -0.03 | -0.03 |
| Kennesaw St. | ASun | 0.09 | 0.09 | 28.57 | 28.57 | -0.04 | -0.04 |
| Chicago St. | WAC | 0.09 | 0.09 | 3.33 | 3.33 | -0.09 | -0.09 |
| Nicholls St. | Slnd | 0.09 | 0.09 | 60.71 | 60.71 | 0.02 | 0.02 |
| Penn St. | B10 | 0.09 | 0.09 | 61.76 | 61.76 | 0.02 | 0.02 |
| UNC Wilmington | CAA | 0.09 | 0.09 | 30.00 | 30.00 | -0.04 | -0.04 |
| UCF | Amer | 0.09 | 0.09 | 59.38 | 59.38 | 0.02 | 0.02 |
| Florida | SEC | 0.09 | 0.09 | 62.50 | 62.50 | 0.02 | 0.02 |
| Norfolk St. | MEAC | 0.09 | 0.09 | 43.33 | 43.33 | -0.01 | -0.01 |
| Howard | MEAC | 0.09 | 0.09 | 25.81 | 25.81 | -0.04 | -0.04 |
| Maryland Eastern Shore | MEAC | 0.09 | 0.09 | 16.67 | 16.67 | -0.06 | -0.06 |
| Monmouth | MAAC | 0.09 | 0.09 | 35.48 | 35.48 | -0.03 | -0.03 |
| Saint Mary's | WCC | 0.09 | 0.09 | 84.85 | 84.85 | 0.06 | 0.06 |
| Fordham | A10 | 0.08 | 0.08 | 29.03 | 29.03 | -0.04 | -0.04 |
| George Washington | A10 | 0.08 | 0.08 | 45.45 | 45.45 | -0.01 | -0.01 |
| Notre Dame | ACC | 0.08 | 0.08 | 57.58 | 57.58 | 0.01 | 0.01 |
| Virginia | ACC | 0.08 | 0.08 | 93.94 | 93.94 | 0.07 | 0.07 |
| Indiana St. | MVC | 0.08 | 0.08 | 37.93 | 37.93 | -0.02 | -0.02 |
| Loyola Chicago | MVC | 0.08 | 0.08 | 84.38 | 84.38 | 0.06 | 0.06 |
| Northern Iowa | MVC | 0.08 | 0.08 | 46.67 | 46.67 | -0.01 | -0.01 |
| St. Bonaventure | A10 | 0.08 | 0.08 | 78.12 | 78.12 | 0.05 | 0.05 |
| William & Mary | CAA | 0.07 | 0.07 | 58.62 | 58.62 | 0.01 | 0.01 |
| Chattanooga | SC | 0.06 | 0.06 | 25.81 | 25.81 | -0.03 | -0.03 |
| East Tennessee St. | SC | 0.06 | 0.06 | 71.88 | 71.88 | 0.03 | 0.03 |
| Lipscomb | ASun | 0.06 | 0.06 | 68.97 | 68.97 | 0.02 | 0.02 |
| NJIT | ASun | 0.06 | 0.06 | 42.86 | 42.86 | -0.01 | -0.01 |
| North Florida | ASun | 0.06 | 0.06 | 36.67 | 36.67 | -0.02 | -0.02 |
| Samford | SC | 0.06 | 0.06 | 26.67 | 26.67 | -0.03 | -0.03 |
| Belmont | OVC | 0.06 | 0.06 | 72.73 | 72.73 | 0.03 | 0.03 |
| Fairfield | MAAC | 0.06 | 0.06 | 51.52 | 51.52 | 0.00 | 0.00 |
| Maryland | B10 | 0.06 | 0.06 | 58.06 | 58.06 | 0.01 | 0.01 |
| Morehead St. | OVC | 0.06 | 0.06 | 22.22 | 22.22 | -0.03 | -0.03 |
| Southeast Missouri St. | OVC | 0.06 | 0.06 | 41.38 | 41.38 | -0.01 | -0.01 |
| Tennessee Martin | OVC | 0.06 | 0.06 | 27.59 | 27.59 | -0.03 | -0.03 |
| Tennessee St. | OVC | 0.06 | 0.06 | 46.43 | 46.43 | -0.00 | -0.00 |
| Tennessee Tech | OVC | 0.06 | 0.06 | 54.84 | 54.84 | 0.01 | 0.01 |
| Wright St. | Horz | 0.06 | 0.06 | 71.88 | 71.88 | 0.03 | 0.03 |
| Duquesne | A10 | 0.06 | 0.06 | 50.00 | 50.00 | 0.00 | 0.00 |
| UMKC | WAC | 0.06 | 0.06 | 27.59 | 27.59 | -0.03 | -0.03 |
| Arizona St. | P12 | 0.06 | 0.06 | 64.52 | 64.52 | 0.02 | 0.02 |
| Columbia | Ivy | 0.06 | 0.06 | 26.92 | 26.92 | -0.03 | -0.03 |
| Coppin St. | MEAC | 0.06 | 0.06 | 15.62 | 15.62 | -0.04 | -0.04 |
| Cornell | Ivy | 0.06 | 0.06 | 40.74 | 40.74 | -0.01 | -0.01 |
| Delaware | CAA | 0.06 | 0.06 | 38.71 | 38.71 | -0.01 | -0.01 |
| Grand Canyon | WAC | 0.06 | 0.06 | 65.62 | 65.62 | 0.02 | 0.02 |
| Illinois | B10 | 0.06 | 0.06 | 41.94 | 41.94 | -0.01 | -0.01 |
| Morgan St. | MEAC | 0.06 | 0.06 | 36.67 | 36.67 | -0.02 | -0.02 |
| Savannah St. | MEAC | 0.06 | 0.06 | 43.33 | 43.33 | -0.01 | -0.01 |
| St. Francis PA | NEC | 0.06 | 0.06 | 57.14 | 57.14 | 0.01 | 0.01 |
| Stephen F. Austin | Slnd | 0.06 | 0.06 | 80.00 | 80.00 | 0.04 | 0.04 |
| Mississippi | SEC | 0.06 | 0.06 | 37.50 | 37.50 | -0.01 | -0.01 |
| Murray St. | OVC | 0.06 | 0.06 | 82.76 | 82.76 | 0.04 | 0.04 |
| Fort Wayne | Sum | 0.06 | 0.06 | 50.00 | 50.00 | 0.00 | 0.00 |
| Georgia St. | SB | 0.06 | 0.06 | 68.75 | 68.75 | 0.02 | 0.02 |
| Houston | Amer | 0.06 | 0.06 | 78.79 | 78.79 | 0.03 | 0.03 |
| Quinnipiac | MAAC | 0.06 | 0.06 | 36.36 | 36.36 | -0.02 | -0.02 |
| Duke | ACC | 0.06 | 0.06 | 78.79 | 78.79 | 0.03 | 0.03 |
| Georgia Tech | ACC | 0.06 | 0.06 | 40.62 | 40.62 | -0.01 | -0.01 |
| Syracuse | ACC | 0.06 | 0.06 | 60.61 | 60.61 | 0.01 | 0.01 |
| Bradley | MVC | 0.06 | 0.06 | 59.38 | 59.38 | 0.01 | 0.01 |
| Drake | MVC | 0.06 | 0.06 | 48.39 | 48.39 | -0.00 | -0.00 |
| Elon | CAA | 0.06 | 0.06 | 40.00 | 40.00 | -0.01 | -0.01 |
| Evansville | MVC | 0.06 | 0.06 | 50.00 | 50.00 | 0.00 | 0.00 |
| James Madison | CAA | 0.06 | 0.06 | 29.03 | 29.03 | -0.02 | -0.02 |
| Missouri St. | MVC | 0.06 | 0.06 | 53.12 | 53.12 | 0.00 | 0.00 |
| Ohio St. | B10 | 0.06 | 0.06 | 75.00 | 75.00 | 0.03 | 0.03 |
| Richmond | A10 | 0.06 | 0.06 | 37.50 | 37.50 | -0.01 | -0.01 |
| San Francisco | WCC | 0.06 | 0.06 | 53.12 | 53.12 | 0.00 | 0.00 |
| Tulsa | Amer | 0.06 | 0.06 | 61.29 | 61.29 | 0.01 | 0.01 |
| UC Davis | BW | 0.06 | 0.06 | 66.67 | 66.67 | 0.02 | 0.02 |
| Valparaiso | MVC | 0.06 | 0.06 | 43.33 | 43.33 | -0.01 | -0.01 |
| American | Pat | 0.03 | 0.03 | 20.00 | 20.00 | -0.02 | -0.02 |
| Creighton | BE | 0.03 | 0.03 | 64.52 | 64.52 | 0.01 | 0.01 |
| Denver | Sum | 0.03 | 0.03 | 46.43 | 46.43 | -0.00 | -0.00 |
| Kansas St. | B12 | 0.03 | 0.03 | 66.67 | 66.67 | 0.01 | 0.01 |
| Minnesota | B10 | 0.03 | 0.03 | 46.88 | 46.88 | -0.00 | -0.00 |
| Eastern Illinois | OVC | 0.03 | 0.03 | 34.48 | 34.48 | -0.01 | -0.01 |
| Eastern Washington | BSky | 0.03 | 0.03 | 56.25 | 56.25 | 0.00 | 0.00 |
| Marshall | CUSA | 0.03 | 0.03 | 69.70 | 69.70 | 0.01 | 0.01 |
| Northern Kentucky | Horz | 0.03 | 0.03 | 68.97 | 68.97 | 0.01 | 0.01 |
| Oregon St. | P12 | 0.03 | 0.03 | 50.00 | 50.00 | 0.00 | 0.00 |
| Prairie View A&M | SWAC | 0.03 | 0.03 | 45.45 | 45.45 | -0.00 | -0.00 |
| Rice | CUSA | 0.03 | 0.03 | 17.24 | 17.24 | -0.02 | -0.02 |
| SIU Edwardsville | OVC | 0.03 | 0.03 | 30.00 | 30.00 | -0.01 | -0.01 |
| Western Kentucky | CUSA | 0.03 | 0.03 | 69.70 | 69.70 | 0.01 | 0.01 |
| Bethune Cookman | MEAC | 0.03 | 0.03 | 53.33 | 53.33 | 0.00 | 0.00 |
| Central Arkansas | Slnd | 0.03 | 0.03 | 50.00 | 50.00 | 0.00 | 0.00 |
| Delaware St. | MEAC | 0.03 | 0.03 | 6.67 | 6.67 | -0.03 | -0.03 |
| Florida A&M | MEAC | 0.03 | 0.03 | 24.24 | 24.24 | -0.02 | -0.02 |
| North Carolina Central | MEAC | 0.03 | 0.03 | 51.61 | 51.61 | 0.00 | 0.00 |
| UCLA | P12 | 0.03 | 0.03 | 65.62 | 65.62 | 0.01 | 0.01 |
| Wisconsin | B10 | 0.03 | 0.03 | 45.45 | 45.45 | -0.00 | -0.00 |
| Yale | Ivy | 0.03 | 0.03 | 50.00 | 50.00 | 0.00 | 0.00 |
| Loyola MD | Pat | 0.03 | 0.03 | 26.67 | 26.67 | -0.01 | -0.01 |
| Oklahoma St. | B12 | 0.03 | 0.03 | 57.58 | 57.58 | 0.00 | 0.00 |
| Rutgers | B10 | 0.03 | 0.03 | 42.42 | 42.42 | -0.00 | -0.00 |
| Southern Miss | CUSA | 0.03 | 0.03 | 40.00 | 40.00 | -0.01 | -0.01 |
| Tulane | Amer | 0.03 | 0.03 | 45.16 | 45.16 | -0.00 | -0.00 |
| Akron | MAC | 0.03 | 0.03 | 41.94 | 41.94 | -0.00 | -0.00 |
| Appalachian St. | SB | 0.03 | 0.03 | 41.94 | 41.94 | -0.00 | -0.00 |
| Arizona | P12 | 0.03 | 0.03 | 79.41 | 79.41 | 0.02 | 0.02 |
| Boise St. | MWC | 0.03 | 0.03 | 73.33 | 73.33 | 0.01 | 0.01 |
| Bryant | NEC | 0.03 | 0.03 | 9.68 | 9.68 | -0.02 | -0.02 |
| BYU | WCC | 0.03 | 0.03 | 70.59 | 70.59 | 0.01 | 0.01 |
| Dayton | A10 | 0.03 | 0.03 | 45.16 | 45.16 | -0.00 | -0.00 |
| George Mason | A10 | 0.03 | 0.03 | 48.48 | 48.48 | -0.00 | -0.00 |
| Hawaii | BW | 0.03 | 0.03 | 53.57 | 53.57 | 0.00 | 0.00 |
| Illinois Chicago | Horz | 0.03 | 0.03 | 50.00 | 50.00 | 0.00 | 0.00 |
| La Salle | A10 | 0.03 | 0.03 | 40.62 | 40.62 | -0.01 | -0.01 |
| Massachusetts | A10 | 0.03 | 0.03 | 39.39 | 39.39 | -0.01 | -0.01 |
| New Mexico St. | WAC | 0.03 | 0.03 | 83.33 | 83.33 | 0.02 | 0.02 |
| Robert Morris | NEC | 0.03 | 0.03 | 48.48 | 48.48 | -0.00 | -0.00 |
| Saint Joseph's | A10 | 0.03 | 0.03 | 50.00 | 50.00 | 0.00 | 0.00 |
| South Carolina | SEC | 0.03 | 0.03 | 50.00 | 50.00 | 0.00 | 0.00 |